“Forever Overhead” is the rubric under which I put everything having to do with surveillance from above (satellites, drones, etc.), but is intended especially to focus on the “democratizing” aspects of the overhead which are open source (such as Google Earth and Google Maps) and the myriad data are put by myriad enterprising Googlers and scholars. It’s a sort of vertical panopticon http://gestaltist.com/2011/05/29/forever-overhead-panopticon-2-0/ –but one in which we can all play the role of warden.
I’m just returning (physically and cognitively) from a long trek to Russia, Mongolia and China via the Trans-Siberian Railway, and Gestaltist grows stale. Unfortunately, I’m slow to recover my capacity for blogging as so many other things. Sine I’ve got a hoard of potential links and short bits on this topic, so rather than sit on them while I convalesce, I’m rounding them up here.
Chinese Enigmas
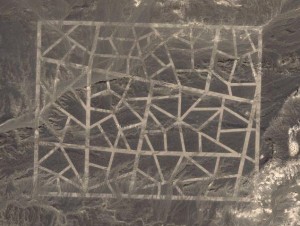
First up and most recent are the recently uncovered imagery, via Google Earth, of these strange structures in China. This Danger Room post is itself a comprehensive roundup of the images and various speculations on their purpose(s).
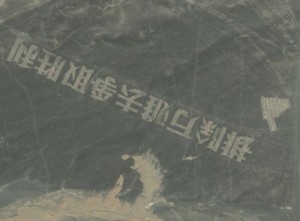
One of the ones I’m most struck by–whose message is clearly less abstruse–is this one. Apparently it reads something like, “Remove ten thousand (i.e. ‘all’) obstacles to strive for victory/success”.
This is in Xinjiang province, (not so) incidentally the site of one of China’s largest ethnic/separatist movements (also incidentally, when I was in China one of my Great Firewall experiments consisted of searching “Xinjiang riots” on Baidu (China’s Google), where the first hit was a Chinese press article asserting that the uprising was staged by provocateurs external to China. The slogan’s a bit of a misnomer, though: there are more than ten thousand Uighurs in Xinjiang.
More images and speculation can be found here.
Pakistan’s Nukes and Google
Many have already read of my fondness for Jeffrey Lewis’s armscontrolwonk blog. Apparently Assistant Secretary of State for Arms Control, Verification and Compliance Rose Gottemoeller cited one of his student’s (Tamara Patton) work modeling Pakistan’s Khushab complex using open source tools and Google SketchUp; since her mention is itself a pretty good summary of the effort, I’ll
meta-quote it here:
She is using freely accessible geospatial tools to gather and analyze
information about the complex’s capacity levels. The really
interesting part comes when she takes the open source satellite images
of the complex and turns those into 3-D models using a freely
available program called Google Sketch-up. This program constructs the
models with dimensions that Patton ascertained using tools in Google
Earth and basic trigonometry. The model is then placed on the map and
textured using observable features.
Through the Keyhole
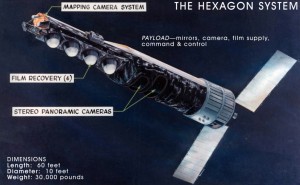
When you’re watching TV or a movie and see some plucky analyst viewing live satellite imagery of somebody or thing, and some officious supervisor looks on or orders the satellite to be retasked to some other target (a newer, more 21st-century of the “enhance” meme) the closest actual thing (that we know about) is the Keyhole satellite.
One of these (albeit much older–a KH-9, we’re currently up to KH-11 at least) was put on display at the National Air and Space Museum… somewhat dramatically, for only one day.
Earth and the Anthroposphere
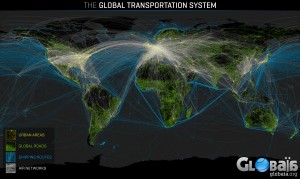
Globaia has produced a series of maps and visualizations attempting to map all current and existing human activity.
After the 34th congress of the International Union of Geological
Sciences, “anthropocene” may become an “official” epoch:
But the concept itself, the idea that human activity affects the Earth
to the point where it can cross a new age, is not new and dates back
to the late nineteenth century. Different terms were proposed over the
decades, such as Anthropozoic (Stoppani, 1873), Noosphere (de Chardin,
1922; Vernadsky, 1936), Eremozoic (Wilson, 1992), and Anthrocene
(Revkin, 1992). It seems that the success of the term chosen by
Crutzen and Stoermer is due to the luck of having been made at the
appropriate time, when humankind became more than ever aware of the
extent of its impact on global environment. It should be noted that
Edward O. Wilson (who suggested Eremozoic, “the age of loneliness”)
popularized the terms “biodiversity” and “biophilia.”
They define the Anthropocene epoch (we’re currently in the Holocene,
though after August 2012 this may no longer be true) thusly:
A period marked by a regime change in the activity of industrial
societies which began at the turn of the nineteenth century and which
has caused global disruptions in the Earth System on a scale
unprecedented in human history: climate change, biodiversity loss,
pollution of the sea, land and air, resources depredation, land cover
denudation, radical transformation of the ecumene, among others. These
changes command a major realignment of our consciousness and
worldviews, and call for different ways to inhabit the Earth.
More maps and related articles can be found at the Anthromes site.
And there’s the “i-tree” software from the US Forest Service:
i-Tree Canopy offers a quick and easy way to produce a statistically
valid estimate of land cover types (e.g., tree cover) using aerial
images available in Google Maps. The data can be used by urban forest
managers to estimate tree canopy cover, set canopy goals, and track
success; and to estimate inputs for use in i-Tree Hydro and elsewhere
where land cover data are needed.
Satellite Archaeology
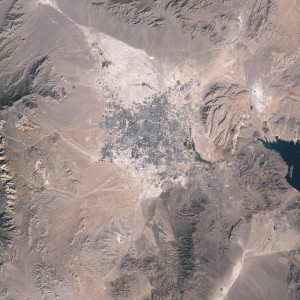
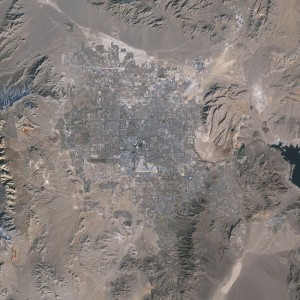
NASA’s Earth Observatory celebrated the 25th birthday of Landsat 5 by
documenting the evolution of Las Vegas sprawl.
A University of Alabama researcher has found at least 17 buried pyramids (as well as more common buildings and streets) using open
source and NASA infrared imagery:
Even ordinary satellite images used by Google Earth have helped. Many
of the old Egyptian sites have buried mud brick architecture that
crumbles over time and mixes with the sand or silt above them. When it
rains, soils with mud brick hold moisture longer and appear discolored
in satellite photos.
‘In the old days, I’d jump into the Land Rover and go look at a
possible site,’ said Tony Pollard, director of the Centre for
Battlefield Archaeology at the University of Glasgow in Scotland.
‘Now, before that, I go to Google Earth.’
X Marks the… You Know
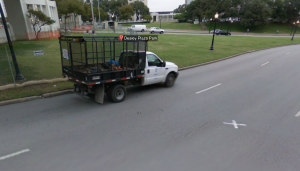
There’s no plaque or memorial commemorating the death of JFK (though there is a cenotaph) at Dealey Plaza, but there is a white “X” on the road where the fatal blow was apparently dealt (both shots, actually).
The X is a bit of a pilgrimage site. There’s even an (obligatory?) planking photo on the X.
The Vertical Panopticon, Liberated
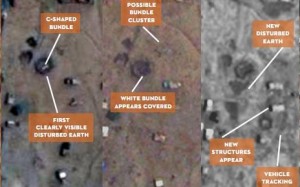
The Sentinel Satellite Project embodies the “democratic panopticon” concept (their slogan is “The world is watching because you are watching”) using open source satellite imagery to track the movements of Sudanese soldiers and tanks against refugees, and even says they’ve discovered mass graves.
That’s it for now. While I’m not out of misc., I am out of time.


